Finance Front
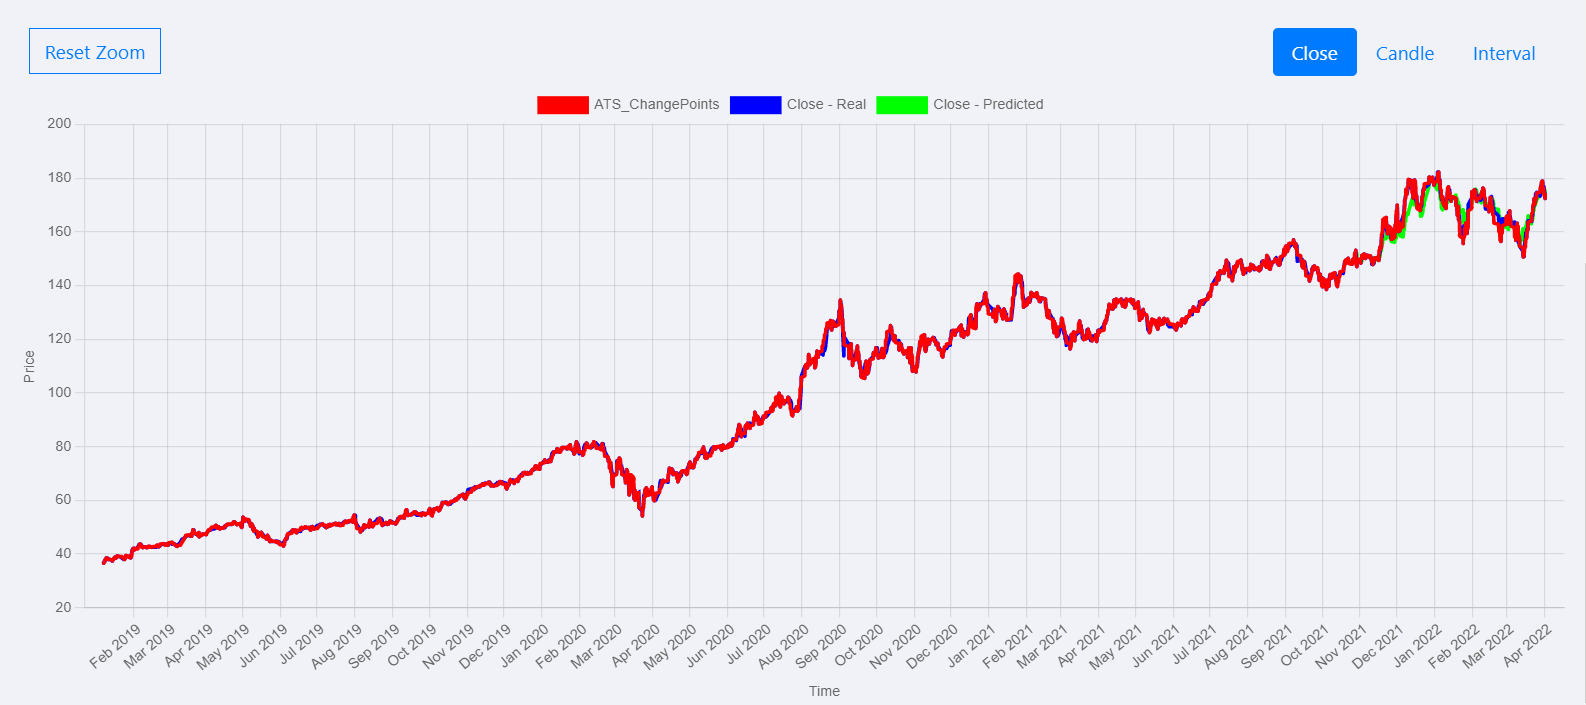
The project shows different kinds of neural network predictions and financial charts, visualizing stock market data and helping traders make informed decisions.
The charts can be zoomed in or out by positioning the cursor over an axis and using the mouse wheel (or the pinching gesture on mobile).
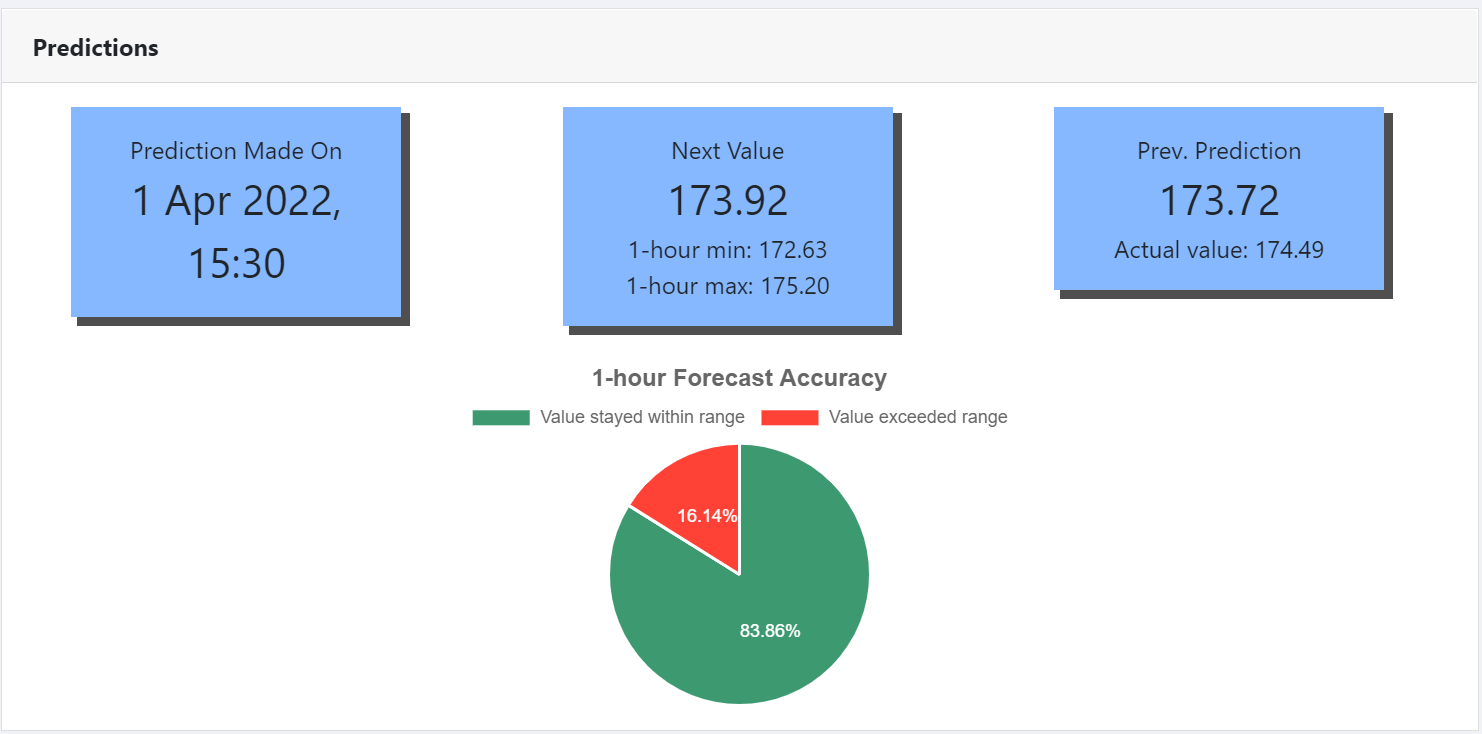
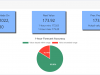
In addition to the chart data, additional types of information are available, such as the approximate next value, value range and movement direction. This information is calculated for different time intervals.

Website: finance.bytesly.net
If you want to check the project out, use these credentials:
Login: ladosha
Password: password